

Monitoring
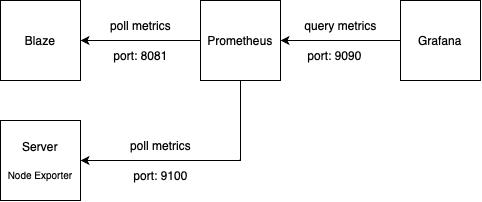
It's recommended to use Prometheus and Grafana to monitor the runtime behaviour of Blaze and of the server Blaze runs on.
Prometheus Config
A basic Prometheus config looks like this:
global:
  scrape_interval: 15s

scrape_configs:
- job_name: 'node'
  static_configs:
  - targets: ['<server-ip-addr>:9100']
  - labels:
      instance: 'blaze'

- job_name: 'blaze'
  static_configs:
  - targets: ['<server-ip-addr>:8081']
  - labels:
      instance: 'blaze'
Import the Blaze Dashboard
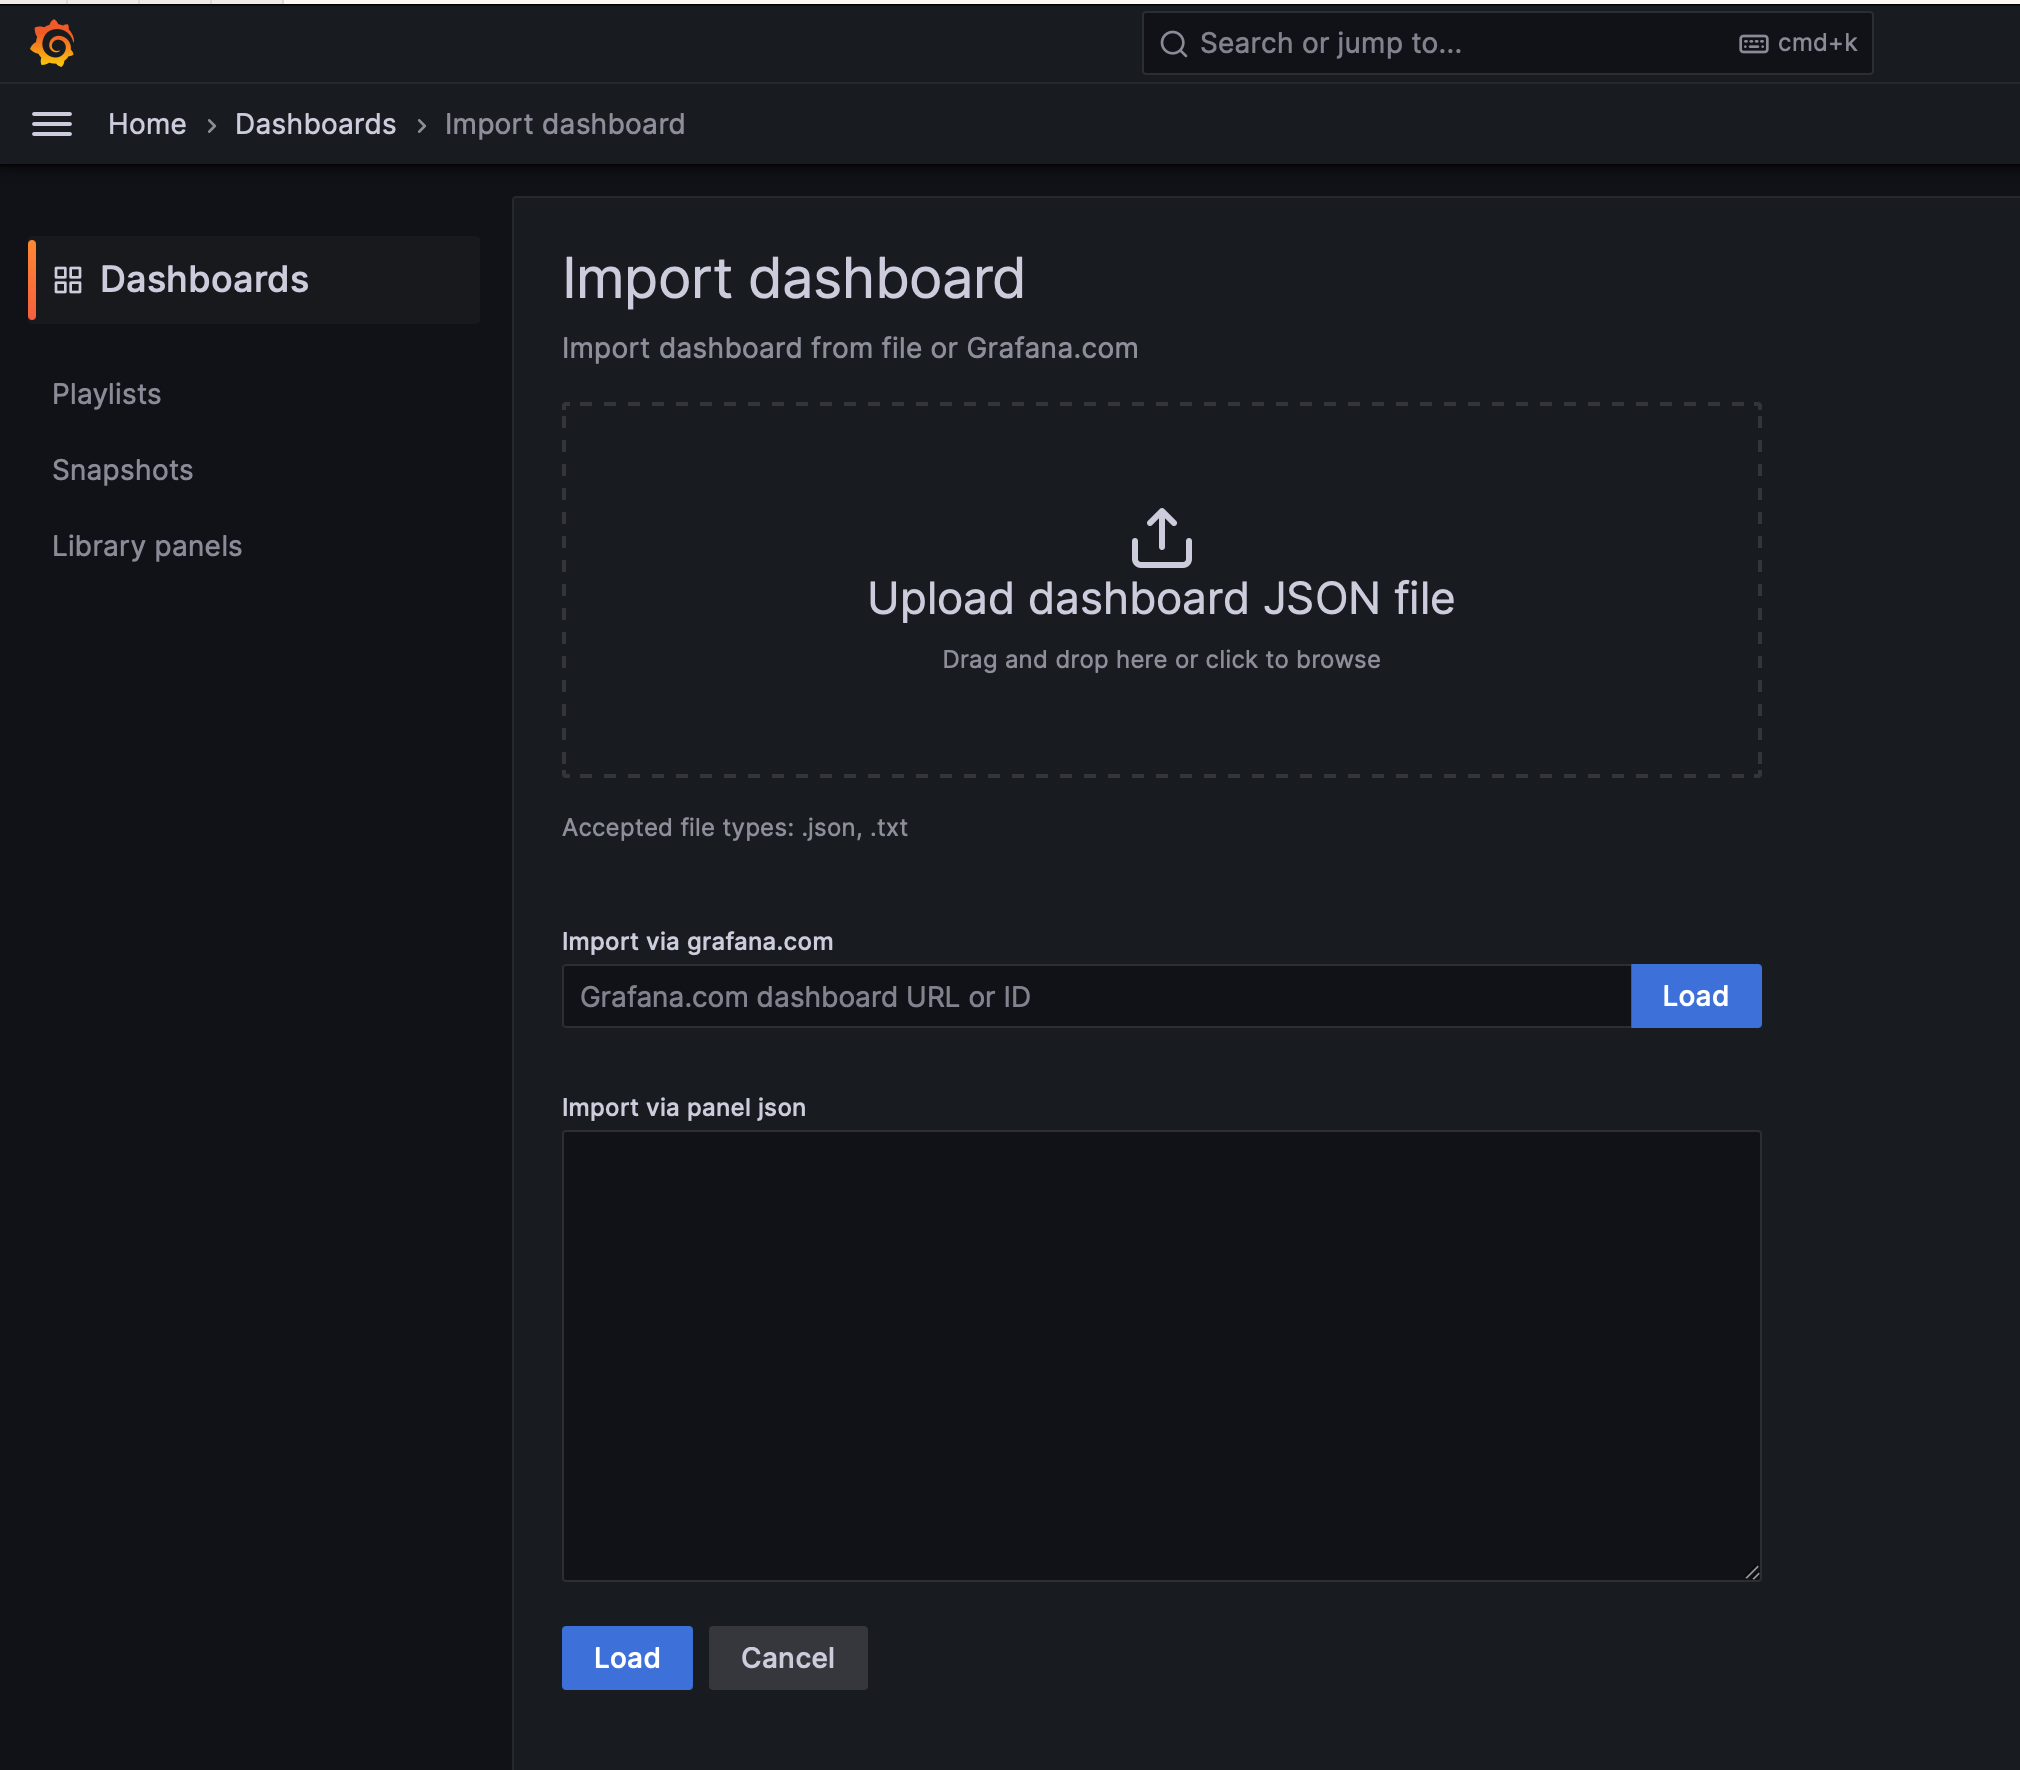
The Blaze dashboard is published as a release asset. Please download blaze-dashboard.json and upload it in the import dialog on the Import dashboard site:
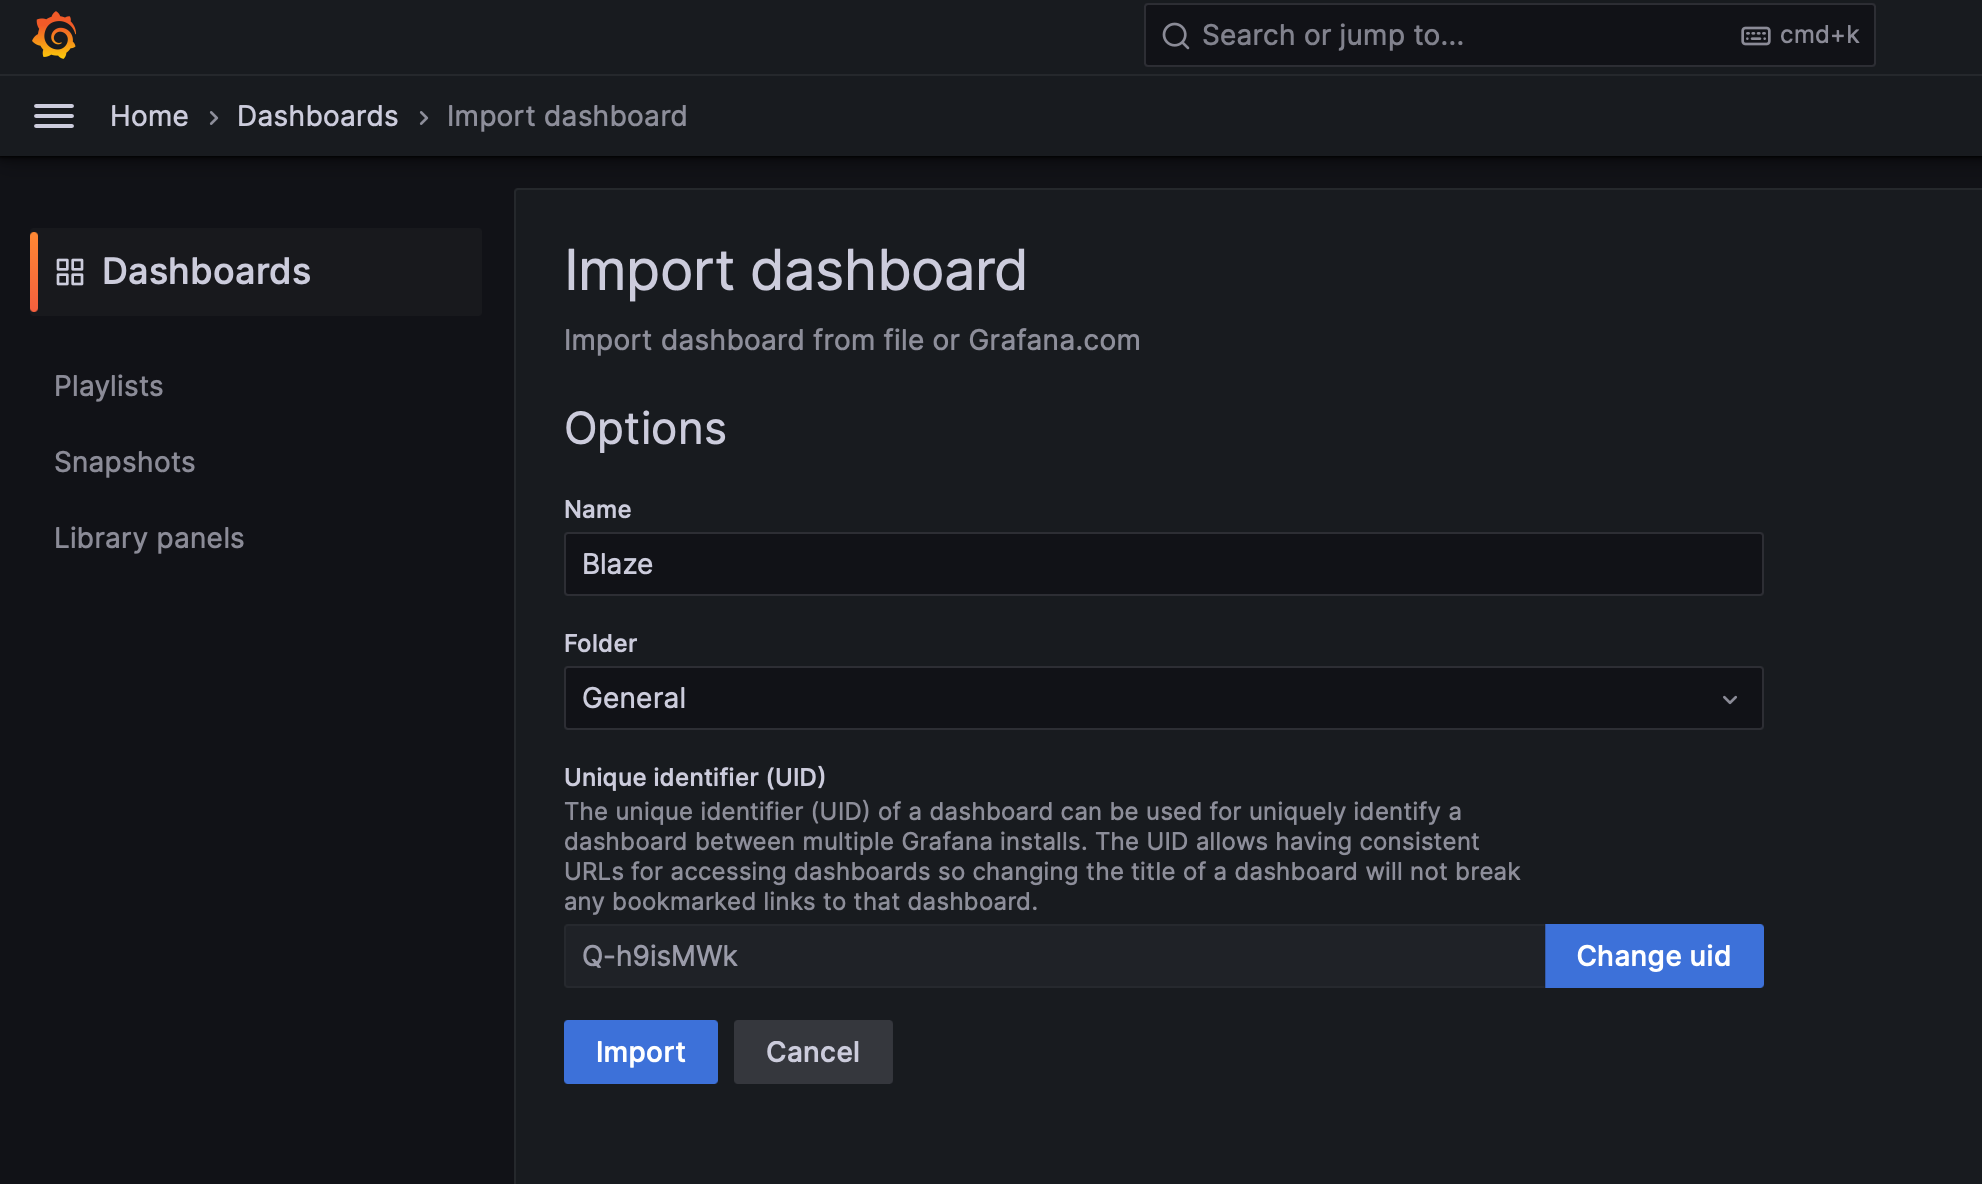
After that, please click "Import" on the next site:
After the Import, the Blaze dashboard should look like this:
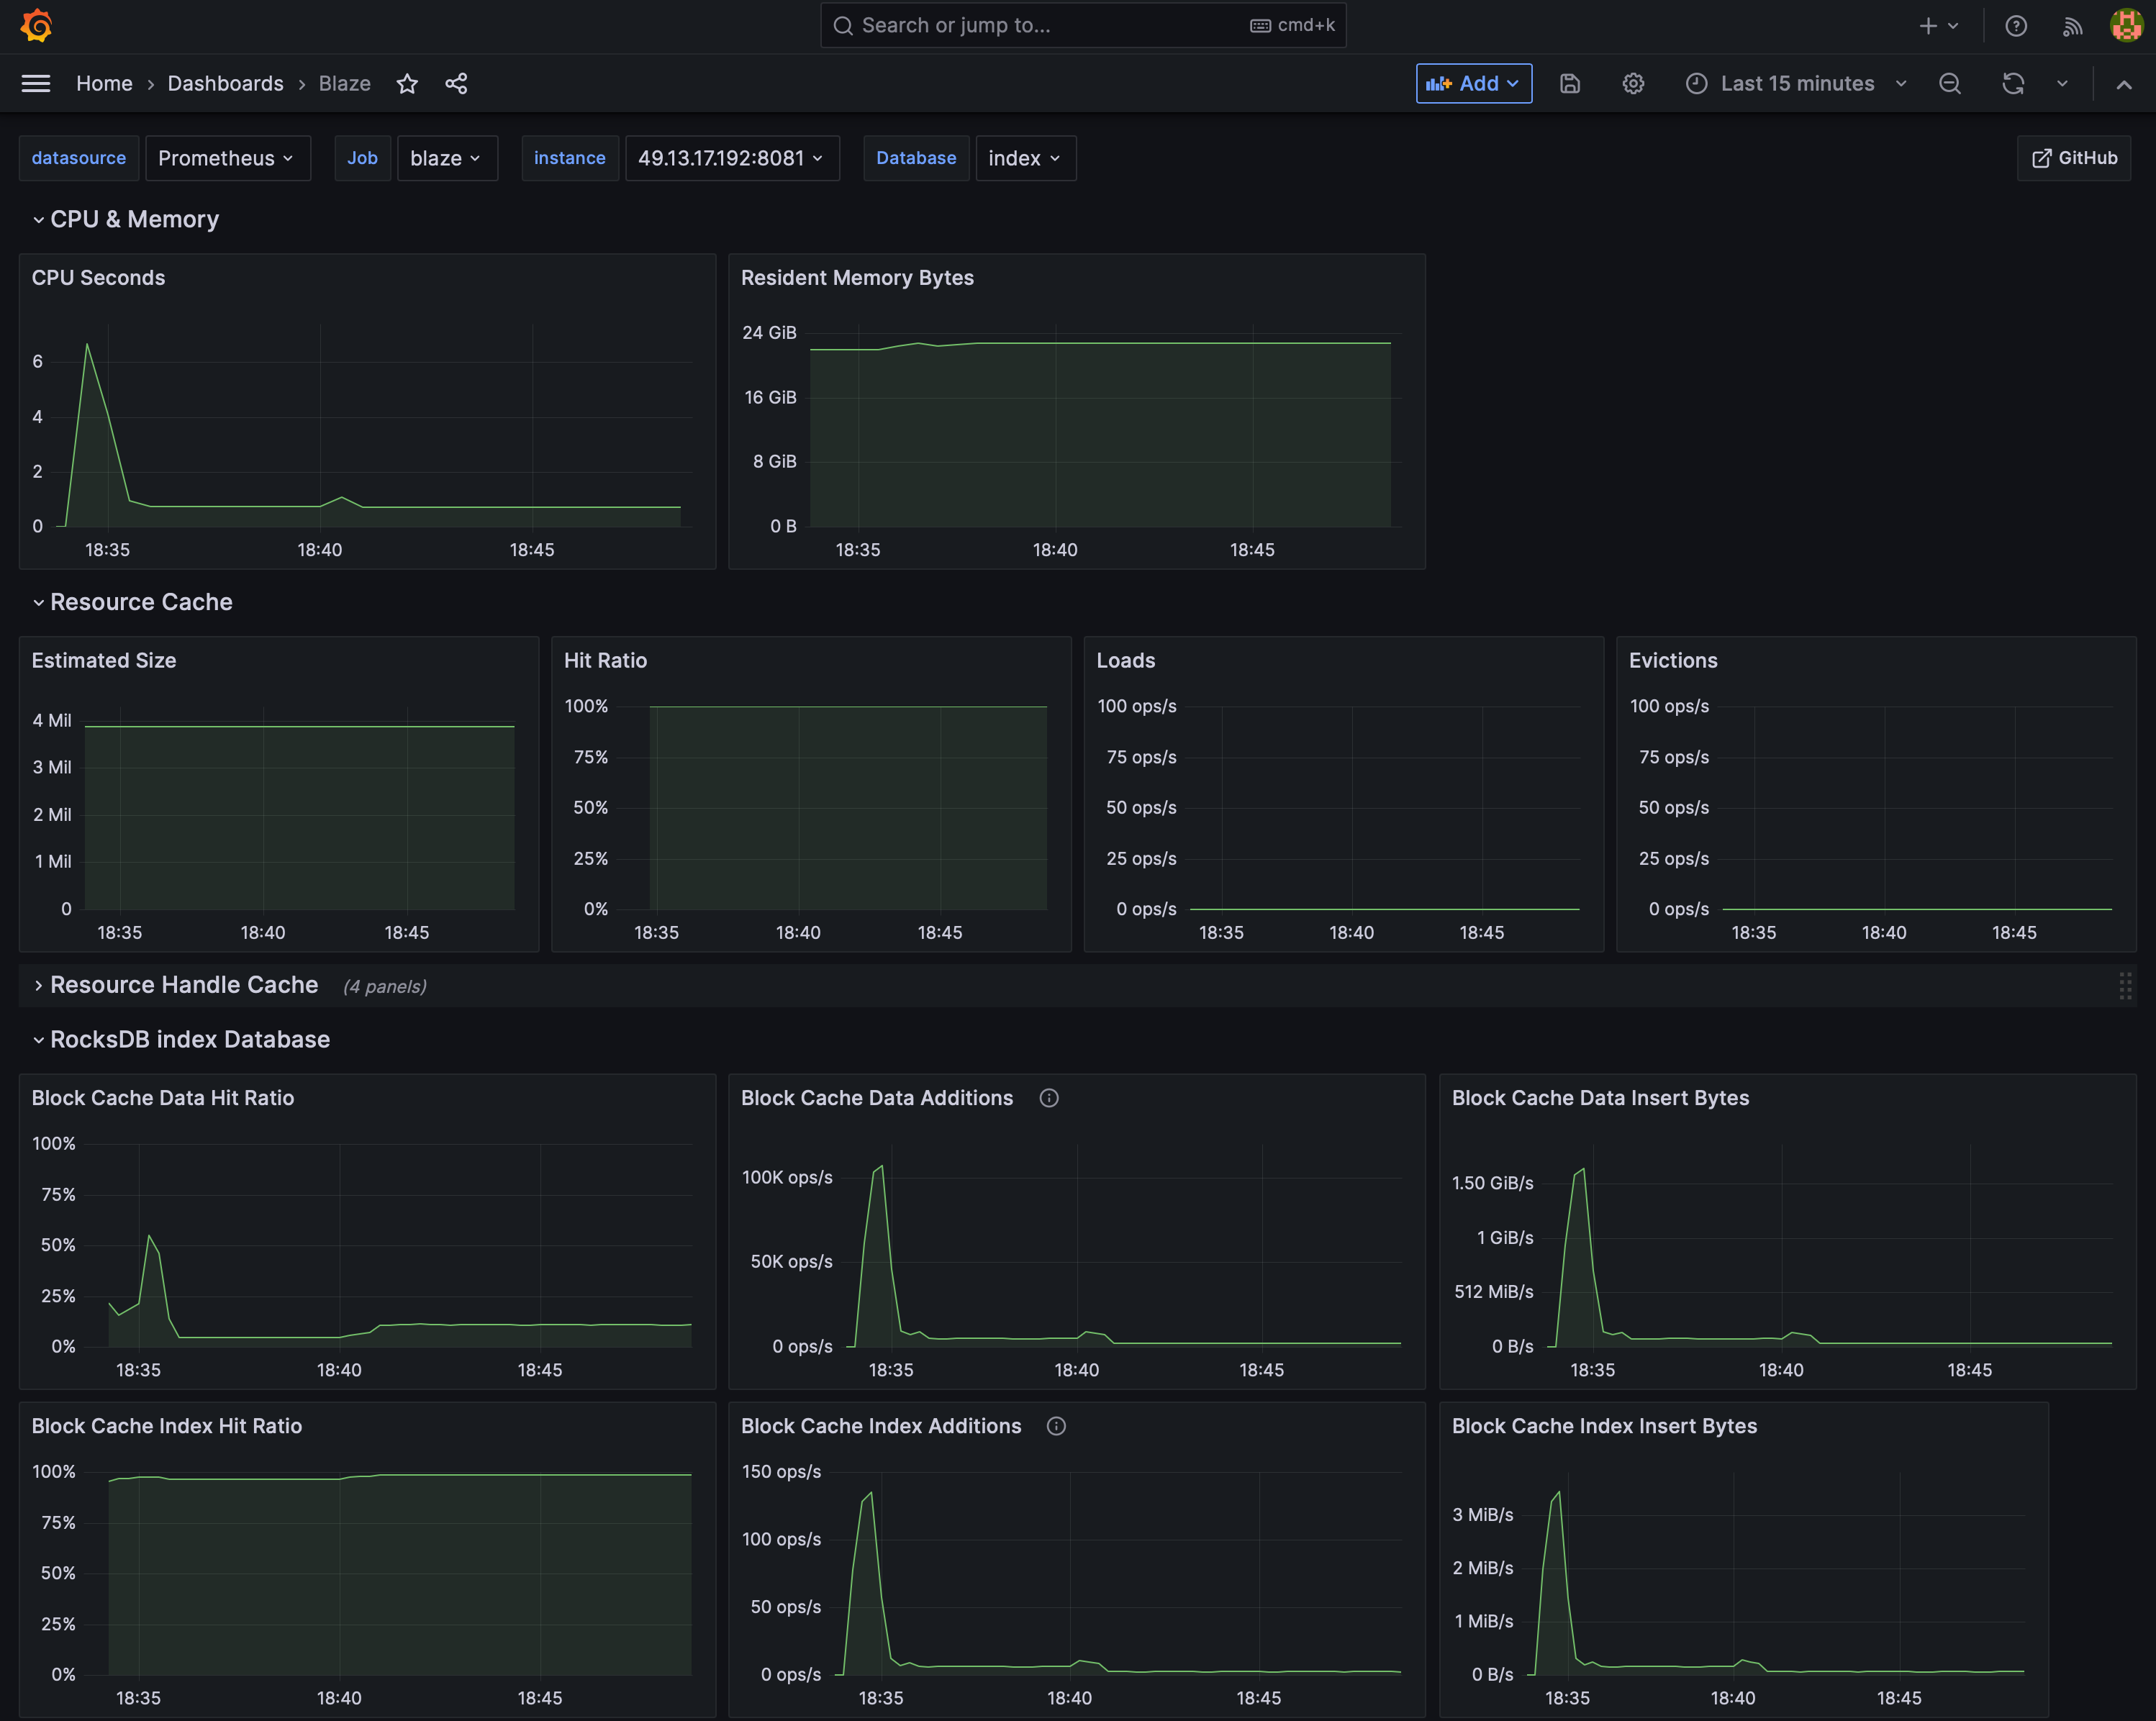
The dashboard is generated from modules/monitoring/dashboard.edn. Maintainers change that file and not the exported JSON. The generated JSON is checked in CI with the Grafana dashboard linter, configured in modules/monitoring/.lint.
Node Exporter for the Server
The Prometheus Node Exporter should be used to gather metrics about the server Blaze is hosted on.